Q1 2025 Review | Consumer Lending

Hi all, Cole here,
We come to you today with our quarterly consumer lending review. Catch up on the latest trends in the consumer lending space:
Takeaways from nonbank and bank earnings:
- Originations (personal loan, BNPL, cash advance, high APR, second look, LTO)
- Credit data (BNPL, cash advance, nonbank, bank)
- Deposits
- And an increase in MPL new issue volume
New here? Subscribe to receive our newsletter each Sunday.
Missed last quarter’s report? Recap key trends with my Q4 Consumer Lending Review.
Consumer Lenders Report Robust Origination Growth
Originations
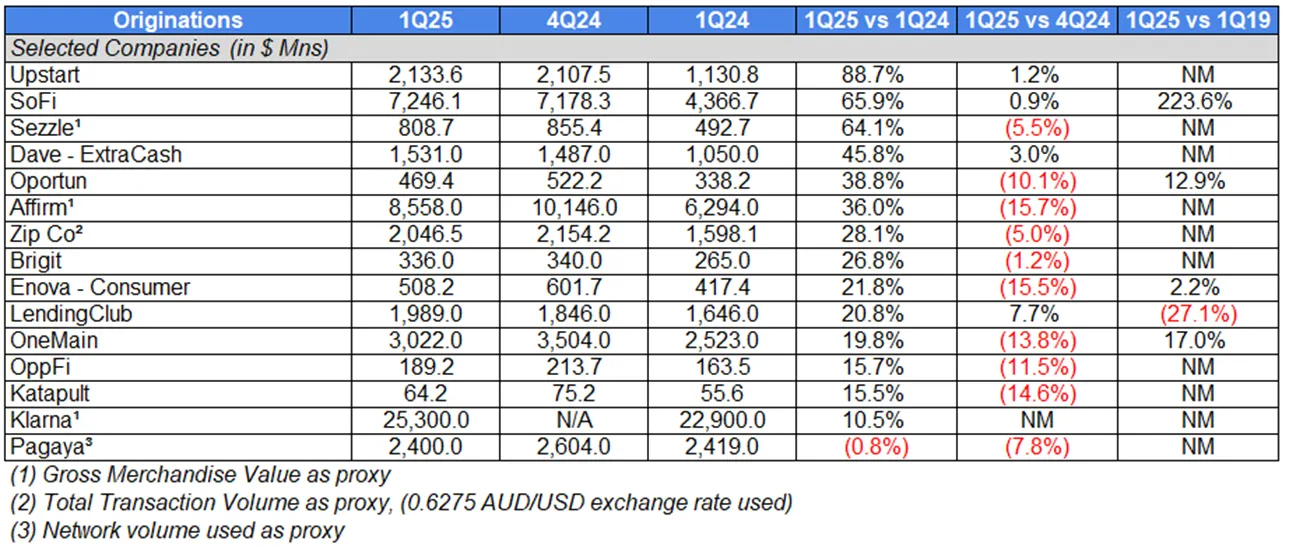
In the first quarter, lenders capitalized on consumer demand for credit, reporting a YoY surge of origination growth across lending products (BNPL, cash advances, higher-APR (36%+ APR) loans, personal loans). A strong labor market has helped lenders ease their credit tightening measures.
Personal Loan-Focused
After a two-year period (mid-2022 to mid-2024) of declining or stagnant originations due to credit tightening efforts, there has been a rapid recovery in unsecured personal loan volumes.
In Q1, Upstart’s +88.7% YoY origination growth accelerated as the lender increased its conversion rate (approving more loans) to 19.1%, from just 14.0% a year prior. Management cited its improvements to underwriting models and strengthening of its capital supply as reasons for the growth. Specifically, Upstart posted strong growth in its small dollar (+182.1% YoY to $70Mn) and super prime (720+ credit score) originations (+77.8% YoY to $658Mn). As a reminder, its small dollar loans have terms of 6-18 months compared to Upstart’s core product (3-5 years) and the average size is “just north of $1,000” compared to $10,000 for its core product.
SoFi also reported elevated levels of growth, with originations up +65.9% YoY, led by personal loans. During the quarter, the fintech launched a new version of SoFi Plus (fee-based subscription offer), which has seen strong cross-sell traction, with 90% of new subscribers being existing SoFi members. In addition, SoFi plans to launch new personal loan and student loan refinancing products. Its personal loan refi product will target prime credit card customers that carry a revolving balance and are making mostly interest-only payments.
On the trading side, SoFi plans to add Level 1 options and “certain crypto and blockchain offerings” this year. What’s more, CEO Anthony Noto explained that,“Given the evolving regulatory landscape, we see an opportunity to reenter the crypto and blockchain business more comprehensively. In addition to enabling members to invest in crypto coins, we will enter other areas over the next 6 to 24 months, but potentially much sooner via acquisition or if the changing regulatory landscape allows.”
Oportun reported strong origination growth +38.8% YoY for the second straight quarter, led by success in its secured personal loan product, whose volumes grew nearly 60% YoY. Oportun’s secured personal loans allow borrowers to secure their loans with their car titles, potentially allowing access to larger loans at lower rates than an unsecured loan. CEO Raul Vazquez detailed Oportun’s success in secured personal loans, stating, “Secured personal loans accounted for 19% of our 1Q '25 personal loan growth. This is constructive to credit quality because losses on secured personal loans were approximately 500 basis points lower than unsecured personal loans last year. Furthermore, $32 million or 7% of Q1 originations were sold to partners.”
Despite the strong quarter, Oportun has been embroiled in a proxy fight with Findell Capital Management (its largest shareholder) which wants to take actions such as changing its Board members (including replacing CEO Vazquez), removing the lender’s 36% APR cap, and reducing opex. In response, Oportun made the decision to reduce board size from 10 to 8 members. Findell Capital was not pleased with the decision, given that Oportun made the decision not to re-nominate Scott Parker, a board member supported by Findell Capital.
LendingClub’s origination growth of +20.8% YoY was driven by its execution of product and marketing initiatives, combined with marketplace investor demand.Loan buyer demand (including from banks) improved loans sales pricing, which was up +200 bps YoY. In April, LendingClub acquired the IP and talent from Cushion, an AI-powered spending intelligence platform. LendingClub believes Cushion’s tech will complement its DebtIQ (debt and spending analysis) experience. The move builds on its acquisition of Tally in 4Q24.
OneMain reported a +19.8% YoY increase in originations, despite maintaining tighter credit standards and higher pricing. OneMain filed an application with theUtah Department of Financial Institutions and the FDIC to form OneMain Bank (an industrial loan company). With the change in administration, a number of nonbank lenders and fintechs have renewed interest in seeking a bank charter. CEO Doug Shulman outlined some of the reasoning for the application, with, “There's real strategic value in a subsidiary industrial bank because it would allow us to provide access to credit to more customers and drive capital generation. It would also allow us to diversify funding, simplify our operating model and drive some operating efficiencies in our credit card business.”
BNPL-Focused
BNPL has remained hot, with consumers increasingly embracing the newer form of payment. Recent Fed data showed 15% of American adults used BNPL in the past year, and the number only continues to grow.
Sezzle’s +64.1% YoY growth in GMV led BNPL players, with its growth driven by increased consumer engagement. Quarterly purchase frequency rose to 6.1x, up from 4.5x a year prior. Additionally, Sezzle Anywhere subscribers are power users of the product, averaging 10 more orders than non-subscribers in Q1. Further, the top 10% of Sezzle’s Anywhere subscribers used the product an average of 35x in the past 90-days.
Affirm’s YoY GMV growth of +36.0% also benefited from a more engaged user, with transactions per active consumer of 5.6x, up from 4.6x a year prior. At the same time, its average order value declined (7)% YoY to $273, in-line with strategy. The Affirm Card has shown consistent expansion, with 1.9Mn active cardholders at quarter end, up +107% YoY and card GMV of $807Mn, up +115% YoY.
Zip Co, a BNPL provider that operates in the U.S., Australia, and New Zealand, reported a +28.1% increase in volumes YoY. For context, a little more than two-thirds of its volumes come from the U.S. market. Zip Co announced that it signed agreements with Tire Agent and Gen-Z favorite Temu (Chinese discount ecommerce). It also expanded its GameStop relationship to include its ecommerce channel.
Klarna released its hotly anticipated F-1 filing as it gears up to go public, revealing +10.5% YoY GMV growth YoY. The Klarna card accounted for 10% of total transactions, up +33% YoY. Additionally, Klarna expanded its eBay partnership to the U.S. and signed partnerships with Walmart’s OnePay and DoorDash.
Cash Advance-Focused
Consumers looking for a way to bridge the gap between paychecks have increasingly turned to earned wage access and short-term cash advance products.
Dave reported a +45.8% YoY increase in originations, driven both by the size of originations (+21% YoY to $192) and by growth in monthly transacting members(+13% MoM to 2.5Mn). 60% of its Q1 originations were under its new standardized fee model (legacy model of optional instant transfer fees and tips), with the full benefit of the fee transition expected in Q2. With the transition to the new model, the average revenue per ExtraCash advance reached $11.40, a +26% increase YoY.
Upbound Group’s acquisition of cash advance app Brigit closed January 31st, for “up to $460Mn”. Brigit also reported strong growth, with cash advance volumes up +26.8% YoY. Like Dave, Brigit grew its average revenue per user +6% YoY to $12.88. Of particular importance, Brigit’s paying users reached 1.2Mn, up +26% YoY. Brigit’s model differs from Dave, as most of its revenue comes from subscription fees (75%+) compared to Dave, which derives the majority of its revenue from fees and interchange.
Higher APR-Focused
Higher-APR lender OppFi, saw originations grow +15.7% YoY, driven by returning customers and credit model improvements. OppFi’s average yield hit 136%, up from130% a year prior.
Enova (offers unsecured installment and lines of credit with APRs 34-200+% depending on state and product type), reported +21.8% YoY growth in consumer originations. Management pointed to strong demand driven by a resilient labor market characterized by rising wages and low unemployment.
Second Look-Focused
Pagaya, a second-look lender, reported flat year-over-year volume growth (down 0.8%) due to a strategic pullback in single-family rental activity. Management explained the move was intended to prioritize profitable growth. At the same time, its combined point-of-sale (“POS”) and auto volumes accounted for 23% of total volumes, up from just 14% a year prior. Pagaya noted that POS is its fastest growing category, with a large portion of POS coming from its partnership with Klarna.
Lease-to-Own-Focused
For those that are unfamiliar, Katapult provides lease-to-own solutions to nonprime consumers. Lease-to-own (“LTO”) offers an alternative to BNPL and credit products, allowing customers to make payments towards owning a product. Customers can make payments to lease, buyout the plan or return the product at any time. On average, Katapult’s typical lease is for about $700.
Katapult grew gross originations over 15% YoY, with 57.4% of originations from repeat customers. Wayfair represented 26.8% of originations. Katapult launchedAshley Furniture and Bed Bath & Beyond in its Katapult app marketplace. In the marketplace, consumers can pay via Kpay (a 1-time user virtual card) or be re-directed to merchant-partner sites.
Credit Data
BNPL
While headlines and memes have pointed to widening losses in the BNPL space, underlying credit data has largely held up.
While the dollar value of Klarna’s consumer credit losses rose +17% YoY, its consumer credit loss rate only inched up +3 bps YoY, to 0.54%.
Affirm’s delinquencies were only marginally higher YoY, with its Monthly Installment Loan 30+ Day DQ Rate (Ex-Pay-in-4) for FY 3Q2025 at 2.4%, up from 2.3% a year prior and below 2.5% a quarter prior.
Zip Co’s net bad debts (annualized net write-offs / opening receivables) improved (8) bps YoY to 1.64%, while rising +11 bps QoQ.
Cash Advance
Even though many users of cash advance products struggle with cash flow problems, the short-term nature of the product and cash flow underwriting capabilities have helped to keep credit from deteriorating.
Dave’s 28-day delinquency rate improved (33) bps YoY to 1.50% and has consistently moved lower over the past few years.
Brigit’s net advance loss rate rose modestly, +20 bps to 2.4% (February and March data only, post-acquisition close).
Nonbanks
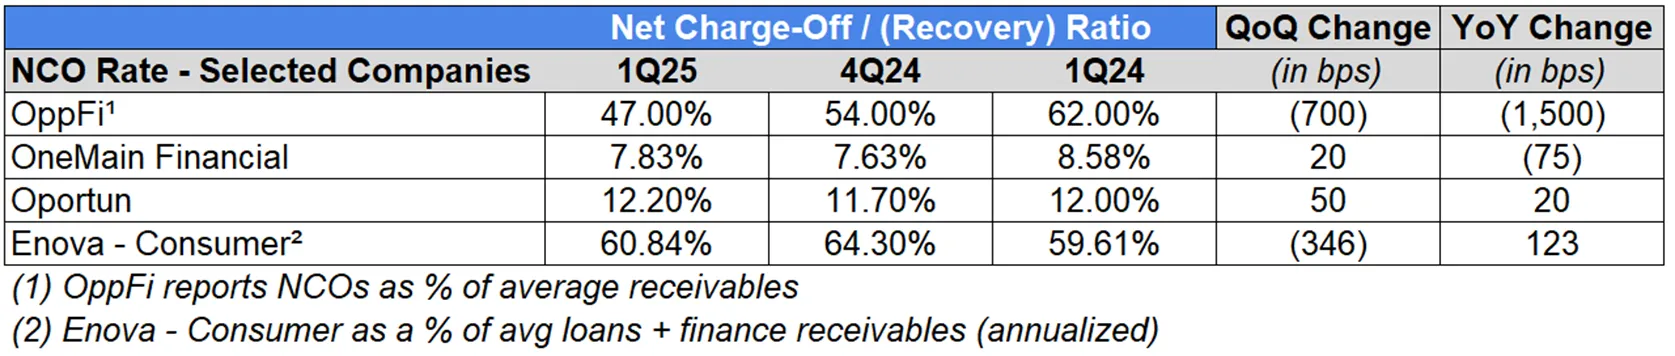
Despite serving a clientele more prone to delinquency, OppFi (1,500) bps improved its NCO ratios YoY. OppFi pointed to its “strategy of seeking profitable growth” as a reason for the improvement in credit quality. In contrast, subprime lender Enova reported a +123 bps rise in NCOs. Despite the rise, strong jobs and wage growth have continued to support Enova’s credit quality.
OneMain Financial (75) bps reported a YoY improvement in its NCO ratio, helped in part by the reduction in the size of its “back book” (pre-Aug 2022 credit tightening).
Oportun reported a slight +20 bps YoY increase in its NCO ratio, but dollar NCOs improved for a sixth consecutive quarter and 30+ day DQs improved for a fifth consecutive quarter.
Banks
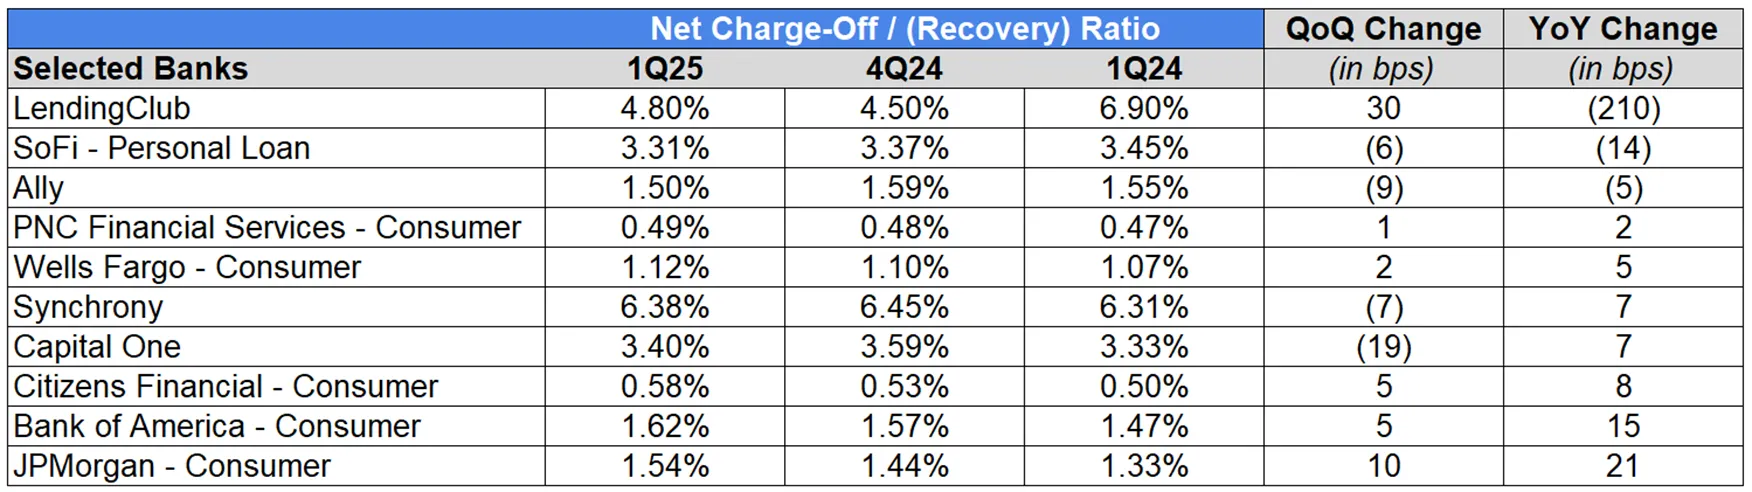
Turning to banks, LendingClub (210) bps, SoFi – Personal Loan (14) bps, and Ally (5) bps improved their NCO ratios YoY while JPMorgan – Consumer +21 bps, Bank of America -Consumer +15 bps, Citizens Financial – Consumer +8 bps, Capital One + 7 bps, Synchrony +7 bps, Wells Fargo – Consumer +5 bps, and PNC – Consumer +2 bps reported increases in NCO ratios.
LendingClub’s improvement can be attributed to the fact (per CEO Scott Sanborn) that it has maintained a credit box “significantly tighter than pre-COVID and a continued focus on higher quality borrowers”.
SoFi saw a slight improvement in its NCO ratio, aided by a favorable comp, as management explained that delinquencies peaked one year prior (1Q24).
While Synchrony reported an increase in its NCO ratio, its 30+ DPDs declined (22) bps YoY and management expects that credit actions it took from mid-2023 to early 2024 will help improve NCOs.
Capital One’s rise in NCO ratio was driven by its credit card portfolio, with its credit card NCO ratio up +24 bps YoY.
Additionally, many bank consumer divisions’ net charge-off ratios have risen above pre-pandemic (1Q19) levels, with Ally +77 bps, Capital One +76 bps, JPMorgan – Consumer +37 bps, Bank of America – Consumer +34 bps, Synchrony +32 bps, Citizens Financial – Consumer +14 bps.
PNC’s NCO ratio came in (19) bps lower than pre-pandemic (1Q19) levels but the bank has grown home equity + residential real estate loans as a % of its consumer loan book from pre-pandemic levels. Looking at broader industry data, these types of loans have carried lower delinquency rates than credit card and auto loans and likely translate into lower net charge-offs.
Dollar NCOs (Banks and Nonbanks)
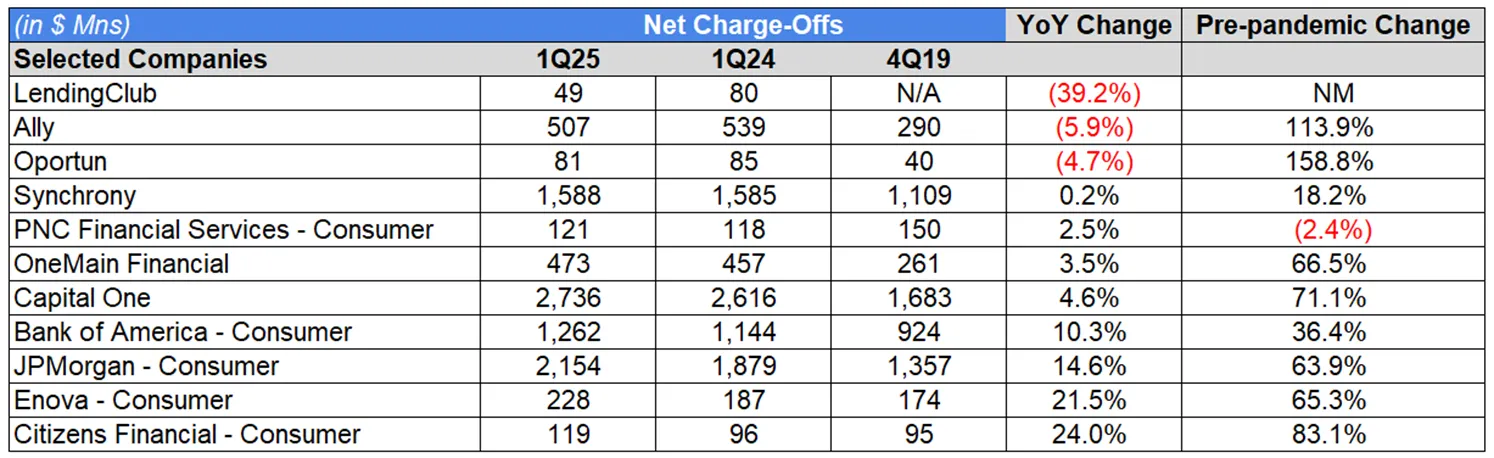
Net-charge offs (in $ values) followed a similar trend, with LendingClub (39.2)%, Ally (5.9)%, and Oportun (4.7)% posting YoY declines in NCOs. Citizens Financial – Consumer +24.0%, Enova – Consumer +21.5%, JPMorgan – Consumer +14.6%, Bank of America – Consumer +10.3%, Capital One +4.6%, OneMain Financial +3.5%, PNC – Consumer +2.5%, and Synchrony +0.2% posted YoY increases in NCOs.
Looking at pre-pandemic figures, net charge-offs at consumer divisions eclipsed 1Q19 figures for Oportun +158.8%, Ally +113.9%, Citizens – Consumer +83.1%,Capital One +71.1%, OneMain +66.5%, Enova – Consumer +65.3%, JPMorgan - Consumer +63.9%, Bank of America – Consumer +36.4%, and Synchrony +18.2%. Only PNC – Consumer (2.4)% reported a decline in net charge-offs.
Deposits
In the first quarter, the Fed held rates steady, despite a moderation in inflation. Major bank consumer divisions reported growth in average deposits, Citizens +0.9% QoQ, Bank of America +0.6% QoQ, Wells Fargo +0.6% QoQ, and JPMorgan +0.3% QoQ.
At the same time, we saw period-end deposits grow QoQ at SoFi +4.9%, Synchrony +1.7%, and Capital One +1.3%. SoFi’s savings deposit growth of +9.6% QoQ outweighed declines in demand and time deposits.
While LendingClub reported a (2.0)% QoQ decline in deposits, its LevelUpSavings product (high-yield savings product in August 2024) has passed $1.9Bn in depositsto date.
Since obtaining bank charters, SoFi and LendingClub have benefitted from a lower cost of funds, with deposits remaining key to funding loans. While SoFi andLendingClub do not rely entirely on deposits, being able to fund at a cheaper rate (SoFi 3.49%, LendingClub 3.91% average yield on interest-bearing deposits) aids profitability. Deposits now represent 90% of SoFi’s funding base. By reducing warehouse utilization, SoFi achieved a lower rate which translates to roughly $515Mn in annualized interest expense savings.
While not a direct comparison, nonbank lenders that utilize other sources of funding (e.g. warehouse lines, ABS markets) have reported significantly higher cost of funds, with Enova’s cost of funds at 8.9% and Affirm’s at 7.1%.
The cost of deposits has eased at banks, driven by Fed rate cuts, with the cost of deposits declining (42) bps at LendingClub, (31) bps at SoFi, (23) bps at Capital One (18) bps at Citizens, (15) bps at Wells Fargo – Total, and (13) bps at Synchrony on a QoQ basis.
MPL New Issue Volume Surges
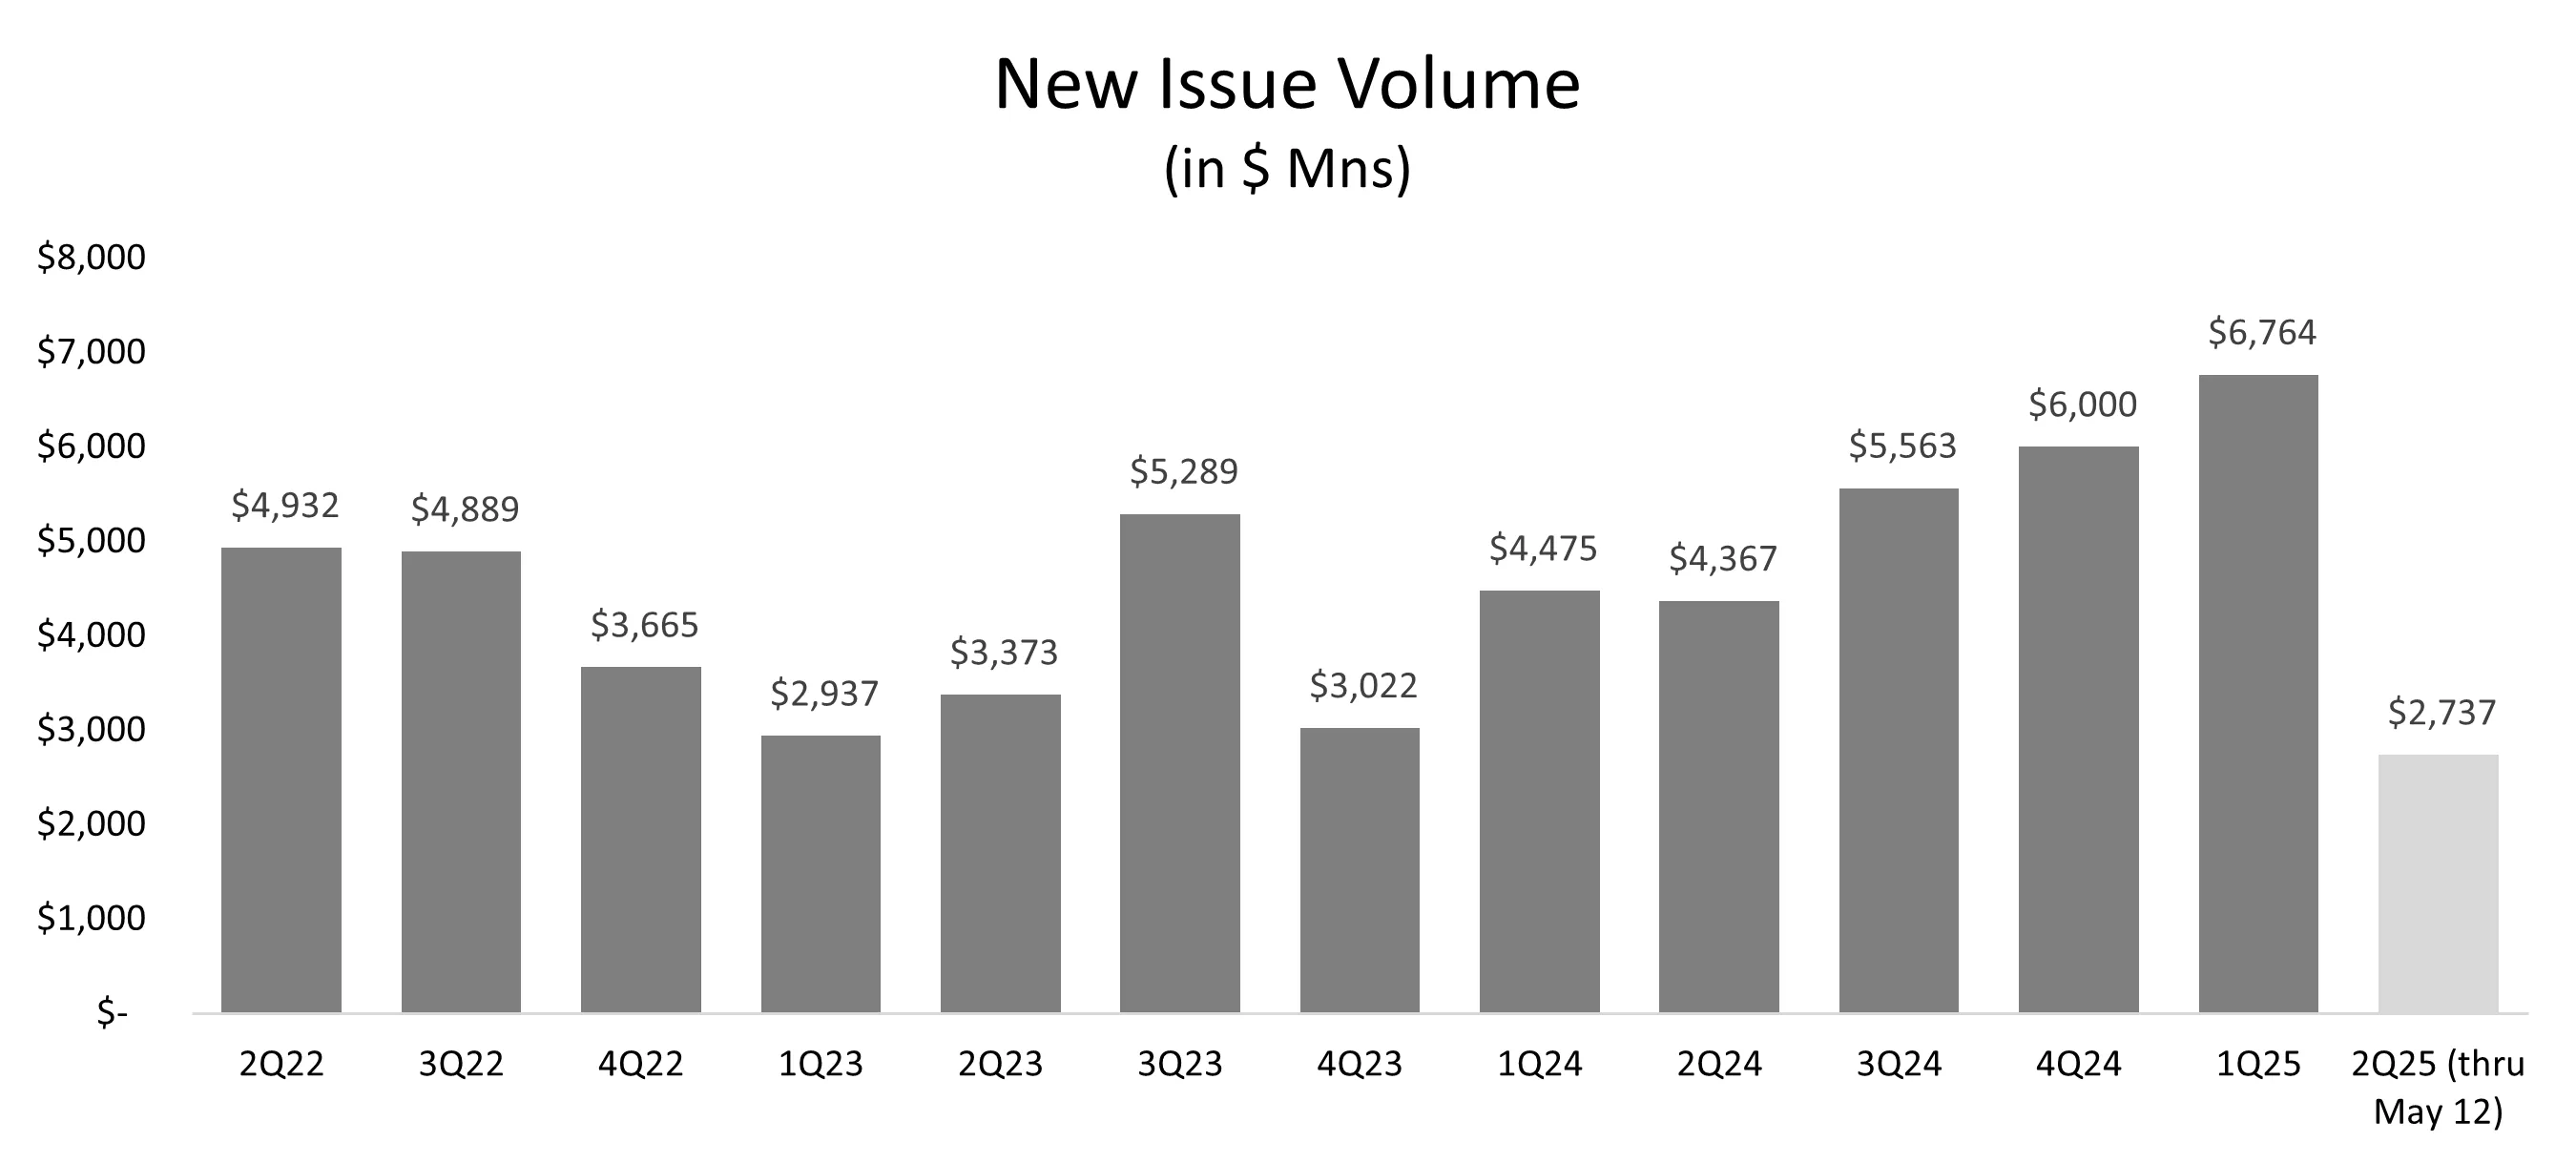
In the first quarter, new issue volume for the consumer unsecured MPL market leapt+51.2% higher on a YoY basis and +12.7% higher on a QoQ basis. The YoY increase in new issue volume was primarily driven by an increase in average deal size ($398Mn vs. $298Mn) but was also helped by an increase in the number of deals (17 vs. 15).
Demand for this paper remains strong, with Affirm noting that its February 2025-1 issuance was 3.6x oversubscribed. Oportun Interim CFO Paul Appleton elaborated on its January issuance of ABS notes, stating, “The transaction was a significant success oversubscribed by more than 7x and pricing at a 6.95% weighted average yield, 127 basis points lower than our previous transaction in August 2024.”
Pagaya - $1,080Mn, Affirm - $1,000Mn, GreenSky - $717Mn, SoFi - $698Mn, Oportun - $584Mn, Bankers Healthcare Group - $396Mn, InterVest Capital Partners - $372Mn, GoodLeap (LoanPal) - $350Mn, Reach Financial - $319Mn, Island Finance Trust - $293Mn, Regional Management - $265Mn, CFG Partners - $225Mn, Avant - $200Mn, Achieve - $193Mn, and Upgrade - $72Mn were among the most active players in the space in the first quarter.
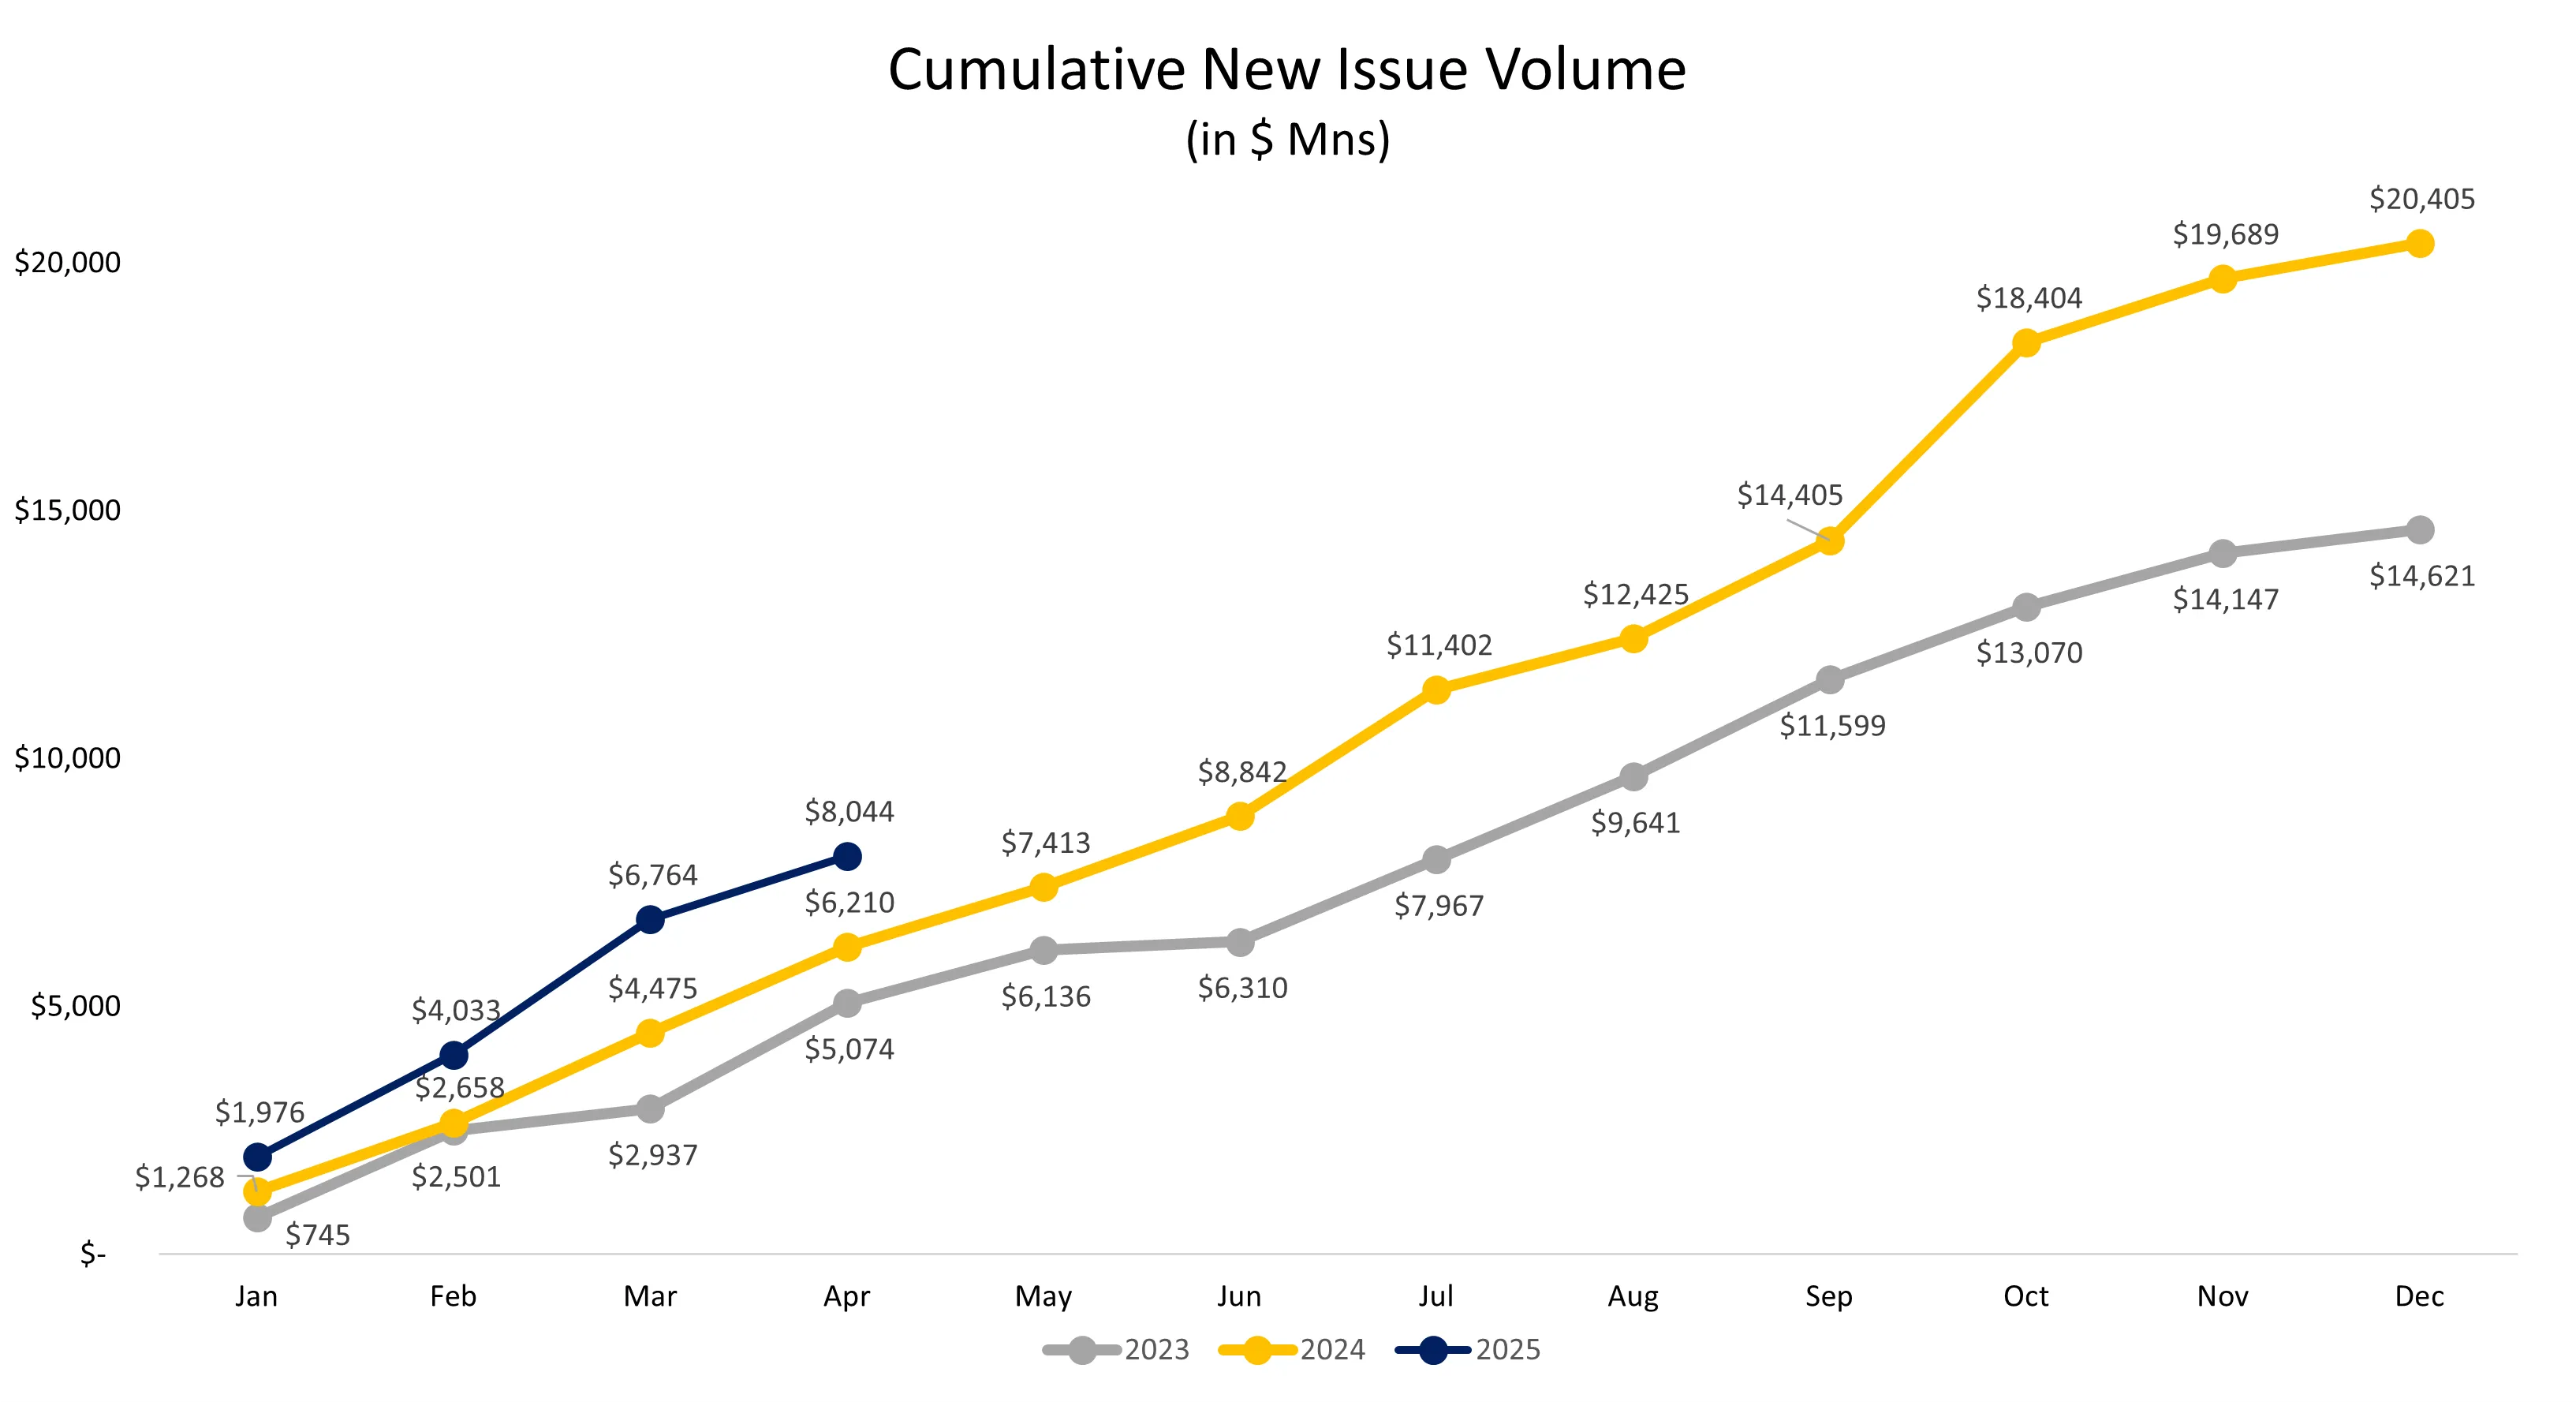
2025 volumes have gotten off to a hot start, with cumulative new issue volume through April of $8,044Mn outpacing 2024 levels by 29.5% and 2023 levels by 58.5%.
Found value in our Q1 report? Subscribe here to receive our newsletter each Sunday.
